1. Introduction to the PERT Diagram
The PERT diagram is an essential project planning tool for project managers. It allows you to:
- See the sequence of tasks to be done,
- Estimate the time required for each step,
- Identify the critical path,
- Reduce uncertainties related to deadlines,
- Identify the most important tasks to monitor.
It is often compared to the Gantt chart, which shows tasks as bars on a timeline. However, the PERT diagram is more effective when a project is complex with many interdependent elements.
2. What is a PERT diagram?
The PERT (Program Evaluation and Review Technique) chart is a valuable tool. It helps solve project planning problems.
It is very useful for showing the relationships between tasks. It helps identify dependencies and estimate the time required for a project.
The PERT chart is a project management tool. It helps plan, organise, and coordinate project tasks.
Created in the 1950s by the United States Navy for Project Polaris. The PERT chart is very useful for organising the tasks required for project planning, regardless of the field.
2.1. Historical Origins
The PERT planning method was developed at a time when the complexity of military projects demanded innovative planning techniques. The U.S. Navy needed to optimise resource management while minimising the risks associated with delivery delays.
This need led to the creation of a tool that made it possible to visualise tasks and their interrelations. It also allowed potential problems to be anticipated.
The PERT diagram quickly gained popularity and was adopted across various industries, from engineering and construction to project planning and software development.
The PERT network was driven by the necessity to manage complex projects. It enabled the visualisation of task relationships and clarified the scheduling between activities.
This need led to the development of a methodology to estimate steps and, by deduction, the duration of tasks.
2.2. Components of a PERT Diagram
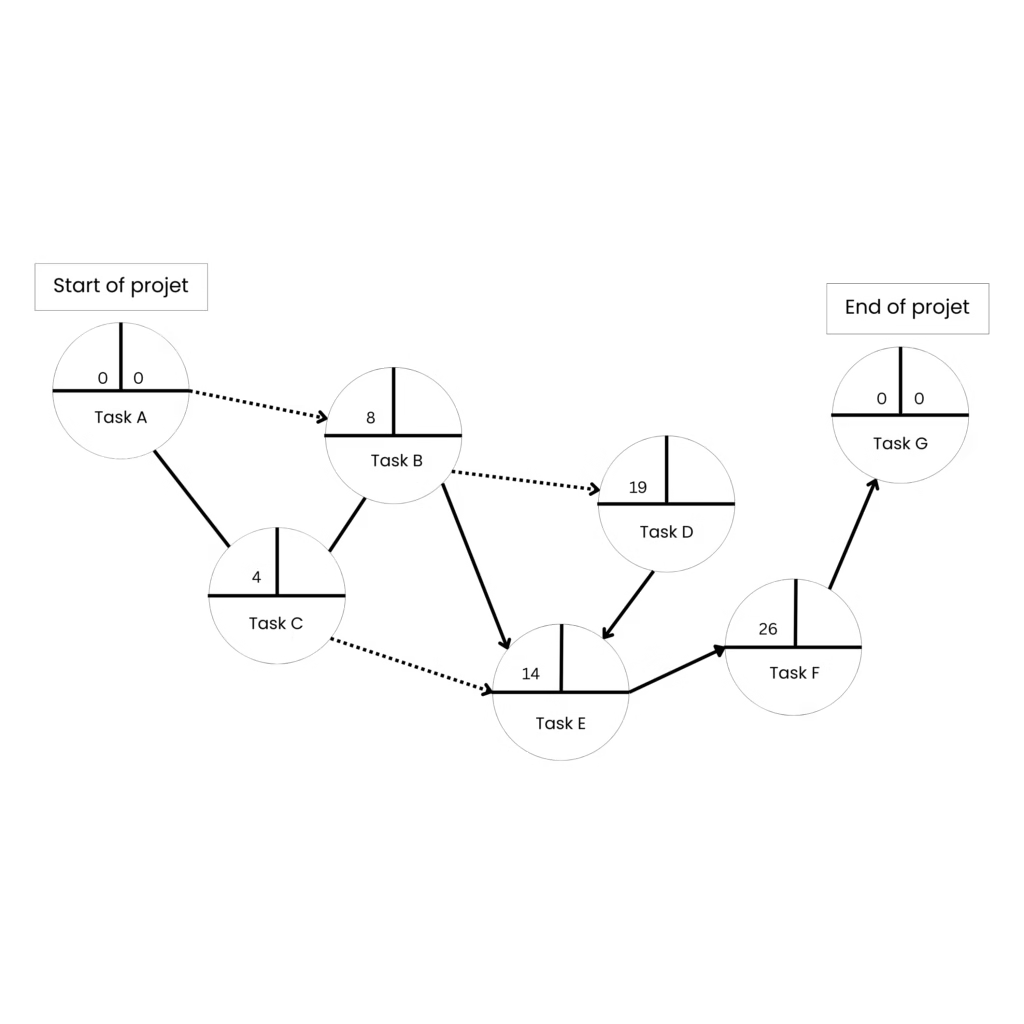
A PERT diagram consists of several key elements:
- Nodes: Represent tasks or start/end events. Each node indicates a specific event in the project, such as the beginning or end of a task. These anchor points are essential for maintaining order and logic in a sequence of tasks.
- Arrows: Illustrate the tasks themselves, connecting nodes to show the order of operations. Each arrow indicates the progression from one task to another, highlighting dependencies. These arrows represent various types of links, such as finish-to-start, finish-to-finish, start-to-finish, and start-to-start.
- Durations: Indicate the time required to complete each task.
3. Why Use the PERT Diagram in Project Management ?
Project management requires meticulous planning and precise execution. For project managers, this means having reliable methods to set priorities, manage risks, and anticipate potential delays. The PERT diagram is a useful tool that helps structure the plan in a clear and logical way. This provides better visibility into the progress of the project.
Using the PERT diagram is especially helpful because it clearly shows the relationships between tasks. This approach is valuable for projects with many dependencies. With its duration estimates, it helps anticipate potential issues.
It also identifies the critical path tasks that must be completed on time to keep the project on schedule.
The PERT diagram helps make better use of resources. It reduces uncertainties by providing an overview of the entire project. This is especially helpful in environments that change frequently.
In short, this tool is indispensable for improving the planning and execution of complex projects.
4. How to Build a PERT Network
Building a PERT diagram involves several methodical steps:
4.1. Task Identification
- List the tasks: Start by identifying all the tasks required to complete the project. This step requires a thorough understanding of the project and its final objectives. Each task must be clearly defined to avoid confusion and ensure all necessary steps are covered.
- Define dependencies: Determine which tasks must be completed before others can begin. Understanding task dependencies is essential to avoid bottlenecks and ensure smooth project progression. This involves analyzing how each task influences and is influenced by others.
4.2. Estimating Durations
Estimate durations: For each task, estimate the optimistic (O), pessimistic (P), and most likely (M) durations.
This estimate should be based on historical data, previous experience, and consultation with experts if necessary.
This allows for contingency planning and minimizes the risk of delays. The average duration of a task is calculated using the following formula: TE = (O + 4M + P) / 6
4.3. Creating and Analyzing the PERT Diagram
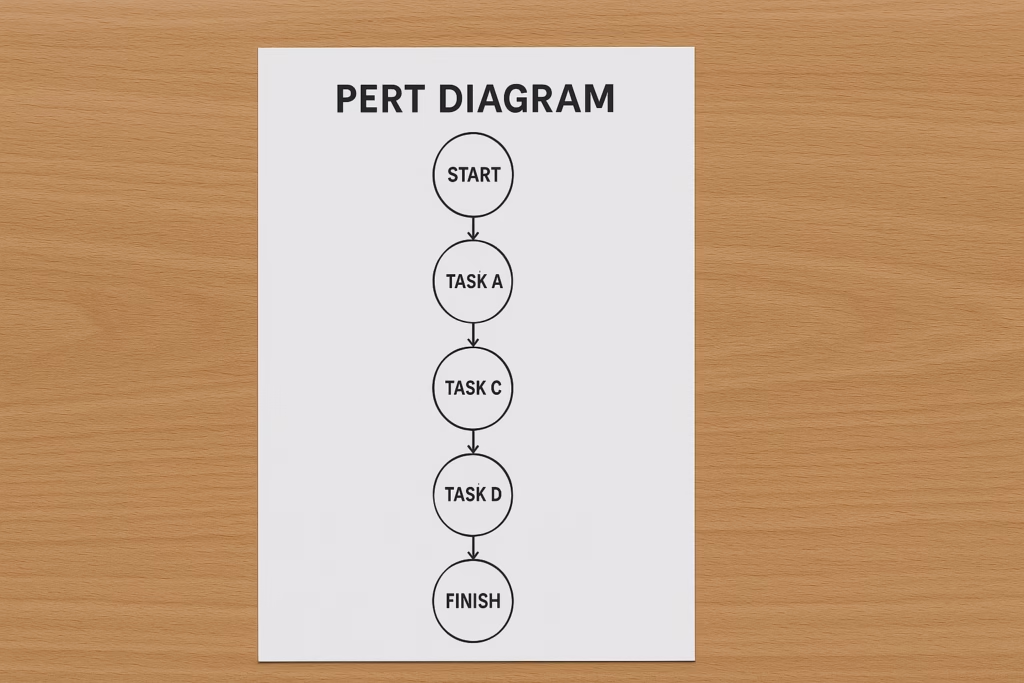
Draw the diagram: Use nodes and arrows to graphically represent the tasks and their dependencies. The diagram must be clear and precise, enabling easy reading of the complex relationships between tasks.
Calculate the critical path: Identify the longest path through the diagram, which determines the project’s minimum duration. The critical path highlights the tasks that cannot be delayed without affecting the project’s end date.
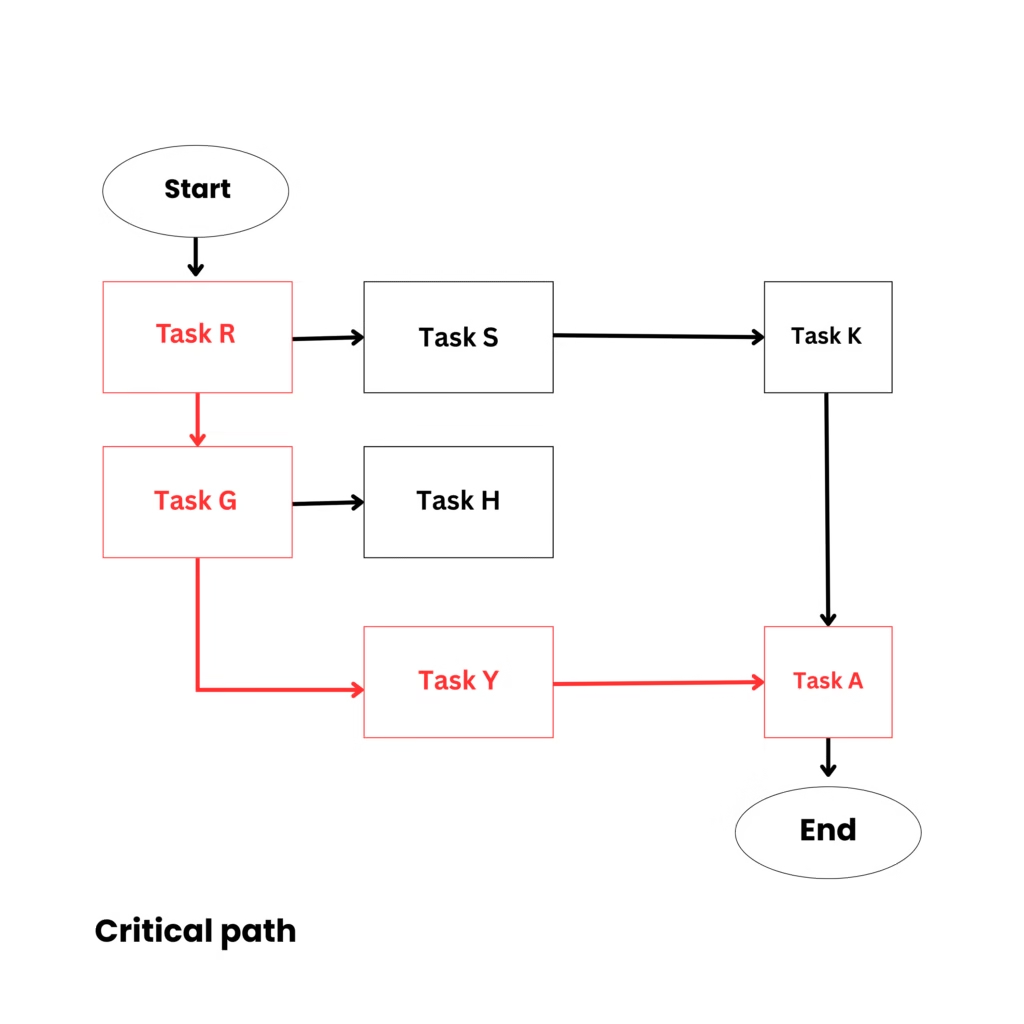
4.4. Calculating the Critical Path
The critical path is a series of tasks that determine the total project duration.
Calculating the critical path is essential. It identifies the tasks that must not be delayed without impacting the project’s deadline.
By identifying these tasks, project managers can focus their efforts on essential activities, ensuring the project proceeds as scheduled.
Effective critical path management also helps allocate resources to optimise project efficiency.
5. Comparison with the Gantt Chart
While the PERT diagram focuses on task relationships and estimated durations, the Gantt chart focuses more on task timelines. Here are some key differences:
5.1. Display and Presentation
The Gantt chart is a bar graph showing tasks. However, the PERT diagram is a network of tasks showing interrelationships. The Gantt chart offers a linear view of project progression, making communication with stakeholders easier.
5.2. Complexity and Adaptability
The PERT network is better suited for complex projects with multiple dependencies. The Gantt chart is simpler to read for linear projects. The PERT diagram’s complexity can be challenging, but it allows for a deeper analysis of interlinked tasks.
5.3. Advantages and Disadvantages
PERT Diagram:
- Advantages: Handles uncertainty and highlights the critical path. These features allow project managers to better control unpredictable variables and focus on the most critical tasks. This is particularly useful in dynamic and uncertain project environments.
- Disadvantages: Can become complex for large projects. As project size increases, managing and updating the diagram becomes more difficult. However, with advanced software tools, this complexity can be more easily managed.
Gantt Chart:
- Advantages: Simplicity, easy for stakeholders to understand. The visual nature of the Gantt chart supports clear communication. Its simplicity also makes it ideal for project management beginners.
- Disadvantages: Less suited to managing uncertainty. The Gantt chart can struggle with adapting to unexpected changes in timing or resources. This can lead to errors if changes are not quickly integrated.
Feature | PERT chart | Gantt chart |
Structure | Task network with dependencies | Horizontal bars on a timeline |
Primary use | Initial planning and risk analysis | Project progress tracking |
Uncertainty management | Yes (multiple estimates) | No (fixed durations) |
Critical path visualization | Yes | Less obvious |
6. Conclusion on the PERT Diagram
The PERT diagram is an indispensable tool for project managers, planning engineers, and technical teams.
It enables detailed planning, better deadline estimation, and proactive management of critical dependencies.
However, the success of a project does not rely solely on a tool. It also depends on:
- Strong team communication,
- Effective resource management,
- Adaptability to unforeseen changes.
It is recommended to use PERT in conjunction with other methods, such as : the Gantt chart or Agile methodologies, for a more comprehensive approach.
Also, don’t forget to involve stakeholders from the beginning to refine estimates and improve schedule accuracy.
Finally, stay up to date through ongoing training and shared experiences. Attending project management seminars or workshops can enhance your skills and improve your effectiveness.
MESLI Consulting offers training in multi-trade planning (TCE).
For more information, please explore our TCE planning training programs.